The Butterfly-Harmonic Pattern

The Butterfly-Harmonic Pattern
-Forex
Trader’s Perspective-

As explained in our introduction,
Harmonic Patterns use Fibonacci retracement tool, to enable the trader determine
turning points (trend reversal zones) with nearest accuracy.
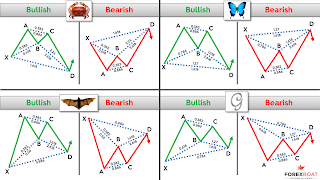
All Harmonic Patterns are shaped in a
zigzag formation, “M” shape depicting an uptrend and a “W” depicting a
downtrend.
The Butterfly like all Harmonic patterns,
has five points - namely, “XABCD”.
As always, the market will provide the
“XA” leg – being the impulse leg or move. The trader therefore is expected to identify
the remaining “BCD” points.
Therefore, using the Fibonacci retracement
tool, you can measure and identify “BCD” points based on the following
measurement guidelines or Criteria: -
Plot the Fibonacci from peak of to
the lowest point on the chart, then identify: -
1) Point B: Which should be at
around level 78.6, retracement of leg “XA”.
2) Point C: Which should be between
38.2 and 88.6, retracement of leg “AB”.
3) Point D: Which should be between
127.2 and 161.8, *expansion of leg “XA”.
*Expansion refers to a scenario
where; trend line breaks below the support level (Point D).
Note: All
Harmonic Patterns ends/completes at point “D”. This is known as “Point Reversal
Zone”.
Therefore to ascertain completion of
a Harmonic Pattern, you look for trend rejection signs, which are depicted by trend-reversal
signs (a confluence of indicators) including: -
·
Head and Shoulder
· Double top
· Candlestick formation (e.g. the
Engulfing pattern)
·
Stochastic indicator (oversold/overbought)
and MacD indicator (Divergence/Convergence).
NB: Harmonic patterns are better traded on Higher time frames, from H4 going up.
On Stop Loss (SL), rules recommend
that it is placed a few pips below or above point “D”. Therefore, in the Butterfly
pattern, it should be placed above/below level 161.8 – Bearish/Bullish
respectively.
Take Profit (TP) in Harmonic Patterns is realized at the following levels: -
·
First TP is at 38.2
·
Second TP is at 61.8
NB: You measure Take Profit (TP) by plotting
the Fibonacci retracement tool, from the highest point of the impulse wave (i.e.
point “A”), all the way down to the lowest point of the pattern (i.e. point “D”).
Harmonics are very useful patterns
in trading. Most research indicate that they have an accuracy rate of 80%.
It therefore
goes without mentioning that; traders (in Forex or Stock markets) learn, understand and effectively apply these patterns.
OJ
Mwale – Sani Global

Comments
Post a Comment