Harmonic Patterns
Harmonic Patterns

–A Forex Market Trader’s Perspective–
Harmonic patterns are formations on forex charts, created by price movements in the market.
These patterns assist the trader to: –
-
Analyze the forex market and forecast its price movement with precision therefore
-
Determine potential trend-retracement areas (entry and exist points) with the highest possible accuracy.
In other words;
Harmonic patterns use Fibonacci retracement levels to geometrically
draw patterns that depict potential trend-reversal zones, thereby
assisting the trader to precisely highlight the best trade entry/exit
points.
Due
to their proven accuracy in pin-pointing potential trend-reversal zones
in forex market, Harmonic Patterns are key (advanced) tools in the
trader’s box.
Harmonic Patterns are usually characterized by “M” (Uptrend) and W” (downtrend) shapes and can be categorized into Seven basic patterns:
Gartley, Butterfly, Crab, Bat, Shark, Cypher and Deep Crab, as briefly introduced below: –
-
The Gartley Pattern:
This is the most frequently used pattern in Harmonics.
Like
all other Harmonic patterns, the Gartley uses Fibonacci ratios to
identify break-outs, support, resistance and more importantly
trend-reversal areas with utmost precision.
Its bullish formation for instance, starts with an uptrend that is followed by a small downtrend
(reversal) then another smaller uptrend followed by a larger reversal at the end – forming the “M” shape in the process.
The
Gartley Harmonic pattern was developed by H.M. Gartley in 1932 and
published in his book titled; “Profits in the Stock Market”.
(Read: -
https://tinyurl.com/y4zw94f7 ).
(Read: -
https://tinyurl.com/y4zw94f7 ).
-
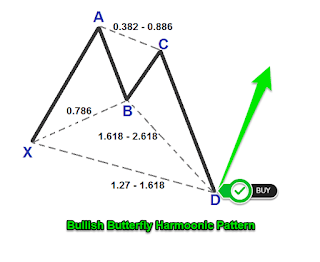
The Butterfly Pattern:
Similar to Gartley, Butterfly patterns usually appear when a trend reversal is stronger than the previous (original) trend.
Butterfly
Harmonic patterns create triangles which assist traders in their
analysis, determination and decisions on profitable positions to hold –
be it long or short.
(Read: -
https://tinyurl.com/y4swh6yy ).
(Read: -
https://tinyurl.com/y4swh6yy ).
-
The Crab Pattern:
The Crab Harmonic pattern is a more condensed pattern than the Butterfly due to its ability to capture smaller price movements.
It
enables the trader to closely monitor and identify relatively minor
price movements, thereby minimizing the impact of price volatility and
therefore maximizing returns on trade.
-
The Bat Patterns:
The
Bat Harmonic pattern is a retracement and continuation pattern which
forms when a trend reverses temporarily and but continues with its
original trend. It is similar in appearance to the Gartley pattern, but
not necessarily the same.
Major differences between is in their Fibonacci levels as well as their inner retracement points.
-
The Shark Pattern:
Discovered by Scott Carney in 2011, the Shark Harmonic pattern is one of the new arrivals on the market.
Its
formation is shaped with a steep outside lines and shallow dip in the
middle, creating a dorsal (tall triangular) fin-resembling chart. Hence,
its “Shark” name.
-
The Cypher Pattern:
This Harmonic pattern was discovered by Darren Oglesbee.
The
Cypher Harmonic pattern has characteristics of wave like appearance
which seem to display “either rising peaks or falling valleys”.
Conservative
traders using the Cypher Harmonic pattern, often look other
confirmation indicators like including RSI, just to ascertain their
market analysis before taking a trade.
-
The Deep Crab Pattern:
The Deep Crab Harmonic pattern is similar to the Crab Harmonic pattern.
However, the difference is in their retracement levels and in the fact that; the “Deep Crab” incorporates some “Bat” patterns.
In Forex Trading, precision is cardinal. In other words
knowing when to enter or exit a trade is one of key factors that
differentiate between a winning and losing trader, and Harmonic Patterns
are particularly effective in this regard.
These
tools essentially track market-trend patterns and accordingly highlight
areas of demand and supply (support and resistance) in the market, thus
assisting traders to take their long or short entries with more
confidence.
It is necessary therefore that we highlight the following key characteristics of Harmonic Patterns:-
-
All Harmonic Pattern use Fibonacci retracement ratios to highlight trend reversal areas.
-
Before the Fibonacci retracement can be used in Harmonics, six more retracement levels together with their six descriptions, must be added to the standard Fibonacci retracement.
On
the MT4 platform, these additional levels and descriptions include;
level 0.786 with 78.6 as its description, level 0.886 with 88.6, level
1.13 with 113 and so forth.
-
On Forex charts, Harmonic Patterns display ‘W’ (bearish) and ‘M’ (bullish) formations.
-
All Harmonic Patterns have ‘Five’ points namely “XABCD”.
However,
out of the Five, the market will always display the impulse wave “X A”.
Hence, the trader is only required to identify the remaining three
points, namely “BCD”.
-
Each of the seven Harmonic Patterns come with a ‘three standard point’ criteria “BCD”, with levels unique from each other.
-
All Harmonic Pattern complete at point “D”, which is also referred to as “Potential Reversal Zone” (PRZ).
-
Stop Loss (ST) should be plotted a certain number of pips below point “D”.
-
In all Harmonic Patterns, Take Profit falls between the levels of 38.2 (1st TP) and 61.8 (2nd TP) of the Fibonacci retracement tool.
-
Trading Harmonic Patterns requires patience. A trader must allow the market to form the pattern.
A market analysis that provides a confluence of indicators in support of a particular decision, is the best approach to achieving lasting success in any trading and Forex Trading in particular
OJ Mwale – Sani Global
lmage: Courtesy of ForexBoat

Comments
Post a Comment