Posts

Harmonics – The Cypher pattern

Image
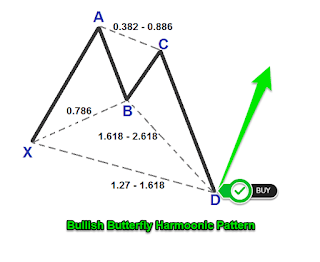
                                         - A Forex Trading Perspective - Like we have explained in our introduction to Harmonics - https://tinyurl.com/y2ghjqkl , Harmonic Patterns enable traders to determine market turning points with precision and high accuracy levels. And like all Harmonic Patterns, The Cypher has five points - namely, “XABCD”. As usual, the market will always provide “XA” which is the impulse leg/move. The trader is therefore required to find the remaining points namely; ‘BCD’.   Using the Fibonacci-retracement tool, you (the trader) measure and identify BCD points using the following measurement Criteria : - >Point ‘B’ is 38.2 to 61.8 retracement of leg “XA”. >Point ‘C’ is between 127.2 and 141.4 expansion of leg “AX”.  >Point ‘D’ is 78.6 retracement of leg “XC”  Important to note that; Point “D” is referred to as; Potential Reversal Zone (PRZ).             It should equally be understood that all legs of the Cy

The BAT Harmonic Pattern

Image
                                         - A Forex Trader’s Perspective - As explained in our introduction to Harmonic Patterns, the Gartley and Butterfly, Harmonic Pattern enable the trader to determine turning points with precision 80% of the time - according to expert traders. As is the case with all Harmonic patterns, the BAT harmonic pattern has five points - namely, “XABCD”.  The market will always provide  points “XA”, which is the impulse move and the longest leg in this pattern. And as usual, the trader is required to find the remaining “BCD” points. Therefore using the Fibonacci-retracement levels, the trader is required to identify BCD points, guided by the following measurement Criteria : - >Point ‘B’ is 38.2 to 50.0 retracement of leg “XA”. >Point ‘C’ is between 38.2 and 88.6 retracement of leg “AB”. >Point ‘D’ is 88.6 retracement of leg “XA” It is important to note that; Point “D” is also referred to as; Potential Reversal Z

The Butterfly-Harmonic Pattern

Image
The Butterfly-Harmonic Pattern - Forex Trader’s Perspective - As explained in our introduction , Harmonic Patterns use Fibonacci retracement tool, to enable the trader determine turning points (trend reversal zones) with nearest accuracy. All Harmonic Patterns are shaped in a zigzag formation, “M” shape depicting an uptrend and a “W” depicting a downtrend. The Butterfly like all Harmonic patterns, has five points - namely, “XABCD”. As always, the market will provide the “XA” leg – being the impulse leg or move. The trader therefore is expected to identify the remaining “BCD” points. Therefore, using the Fibonacci retracement tool, you can measure and identify “BCD” points based on the following measurement guidelines or Criteria : - Plot the Fibonacci from peak of to the lowest point on the chart, then identify: - 1) Point B: Which should be at around level 78.6, retracement of leg “XA”. 2) Point C: Which should be between 38.2 and 88.6, retr

The Gartley - Harmonic Pattern

Image
Harmonic Pattern – The Gartley Harmonic Patterns enable traders to determine turning points with precision and high accuracy. In our introduction to Harmonic Patterns, we indicated that; all Harmonic patterns have five points – namely, “XABCD”. Of the five points, the market always provides “XA” which is the impulse leg/move. Therefore the trader is required to identify the remaining points - “BCD”. The Gartley pattern is the most commonly used harmonic pattern, and it was founded by an American ‘Harold McKinley Hartley’ (H.M. Hartley) in 1932.  Like all Harmonic patterns, The Gartley is based on the Fibonacci retracement numbers, and it is used to help traders forecast/identify turning points on the market-trend chart. It is therefore a good indicator on when to enter or exit trades. Using the Fibonacci tool, the Gartley pattern identifies BCD points by using the following measurement Criteria : - >Point ‘B’ is 61.8 retracement of leg “XA”. >Point