Posts

FIBONACCI – Retracements

Image
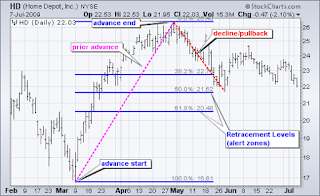
FIBONACCI – Retracements -A Forex Trading  Perspective- Fibonacci is an analytical tool which was invented in the 13th century by “Leonardo Pisa”. In Forex trading, the Fibonacci is one of key tools that assist traders in determining when is the right time to buy or sell. It provides traders with reliable information on what the market has been doing and what it intends doing next – through Retracements as an example . In Forex trading, Retracement can be defined as; price correction (pull-back) during an impulse or larger (up-ward or down-ward) trend. Retracements are simply price corrections rather than actual trend reversals. However, as pull backs, Retracements act as an opportunity for traders to enter trades in their original direction, but take advantage of better prices during the retracement periods. Characteristically, a Retracement is followed by an impulse move which carries on in the original direction. Therefore, they provide a temporary...

Doji Candlesticks

Image
Doji Candlesticks -A Forex Trading Perspective- Doji candlesticks technically signify indecision between buyers and sellers in the market. They form when the opening and closing prices are equal or extremely close to each other. The Doji often appears at the top or bottom of a long market trend, which indicates; a pending trend reversal or a pause before a trend reversal. Doji candlestick patterns are created when demand and supply in the market is at the equilibrium. In other words, where demand (bulls) push prices higher but only to be rejected and pushed lower by the supply (bears), thereby creating indecision in the market. Apparently, in Japanese ‘ Doji’ means; clunker/clumsy/lost momentum/ “ to hesitate ”. Be as it may, we must emphasize that; the Doji essentially depicts indecision rather than a reversal pattern. Its usual appearance following significant upward or downward market trends indicate lost momentum and as such inability by the marke...

Spinning top - Candlesticks

Image
-A Technical Analysis View- From a Forex trading perspective, Spinning tops are candlesticks that depict indecision or a pending trend-reversal in the market. Indecision in the market indicates loss of momentum from both buyers and sellers. An indication that neither buyers nor sellers are in control at that moment. A situation where a trader embraces wait and observe mode. Therefore, when a Spinning top candlestick forms following an up-trend (bullish market), it depicts – buyers losing momentum (Bullish Spinning tops). Likewise, when a Spinning top candlestick forms following a down-trend (bearish market), it depicts sellers losing momentum (Bearish Spinning tops). (Pic. Courtesy of swagforex) Two prominent features are indicative of a spinning top candlestick, namely: – Small body with (long) wicks/shadows extending from both upper and lower sides. Upper and Lower wicks often equal in length. Essentially, wicks indicate the following: – U...

Pipettes in Forex Trading

Image
-A Forex Trading Perspective- Having taken a closer look at PIPs and how to calculate them ( Calculating PIP value in Forex Trading ), it is necessary that we take a glimpse at Pipettes . While a PIP is commonly regarded as smallest fraction currency pairs can move, some brokers saw the need to provide an even smaller “more accurate” fraction in the name of Pipette . A Pipette is a fractional Pip. So given the increasing popularity of Pipettes, some Brokers have started to provide pairs with 5 decimals (for normal/USD based pairs) and 3 decimals (for JPY based pairs). A Pipette is one tenth (1/10) of a PIP, which represents a fraction of one in a hundred thousand (1/100,000).  Simply put, 10 Pipettes = 1PIP . I n all, very few Forex traders currently use Pippets in their trades, so we will not dwell much on it. OJ Mwale – Sani Global Further knowledge/Resources: https://tinyurl.com/yaejznhe https://tinyurl.com/ycorvq5m https://amzn.to/2L9owyi

Calculating PIP value

Image
  Calculating PIP value -Forex Trading Perspective- Calculating value of a PIP is a necessary step in the understanding of  profit/loss, for it enables effective implementation of risk management strategies in Forex trading. PIP values are usually calculated in lot or volume sizes of; Standard lot (100,000 units or 1.0), Mini lot (10,000 units or 0.1) or Micro lot (1,000 units or 0.01). Therefore, given a quote, we calculate PIP value by multiplying the given volume by ‘0.0001’ in USD/other currency pairs, and ‘0.01’ in JPY based currency pairs. For example, a 10,000 EURUSD quote, we can get a PIP value in USD by multiplying 10,000×0.0001=1. Which means; a change (up-ward or down-ward movement) of 1 PIP in this example equals 1 USD. In other words , 1 PIP in this example would equal to a profit or loss of 1USD. And a 20,000 EURUSD quote, PIP value in USD will be (20,000×0.0001) =2USD per PIP, so on and so forth. So, given 10,000 USDJPY quote, the PIP va...

Lot Sizing

Image
-Forex Trading - beginner's Perspective- LOT SIZES: As mentioned in Forex Trading Intro. , the change in currency value relative to another is in a pair, is measured in “ pips ”. And a PIP indicates (very small) percentage change in price for a pair. Due to this 'very small change' in price as indicated by PIPs, that trades are taken in Lot sizes (Lots). Lots come in different sizes, and are allocated as follows: - -Full (standard) Lot = 100,000 Units (1.0) -Mini Lot = 10,000 Units (0.1). -Micro Lot = 1,000 Units (0.01) For Instance: To calculate the value of a PIP given a “GBPUSD” pair, would be done as follows: - As we are aware, a price increase of 0.0001 (in a US$ based pair) is equal to 1 PIP. Say we trade a mini lot of 10,000 units and assume that the GBPUSD exchange rate is 1.2940. Here is how we can calculate value of a PIP: - Formula : (1 PIP in decimal places * trade size) / Exchange rate = Value per PIP. 0.0001*10,000=1 1/1.2940=0.772...

PIP (Point In Percentage)

Image
PIP What is a PIP? What does it represent? - A PIP is a unit of measurement in currency movement, and stands for (Point In Percentage). It is actually a small (unit) measure of movement or change in a currency pair (or quote). Mind you , In Forex trading, Currencies are quoted in pairs. For example EURUSD (EURO and US Dollar) is a currency pair. Where the first currency -in this example- EURO, is referred to as Base currency, and US Dollars a Counter (quote) currency. -In a quotation, a PIP is the last decimal place. Meaning that; a PIP indicates fractional change in price of a currency pair. For instance , In US$ quoted pairs, 1 PIP =   0.0001. In other words , 1/100 th of 1%, or one basis point. This is contrary to Japanese ‘YEN’ based pairs, where 1 PIP = 0.01.  So if the EURUSD price Quote is: 1.1741, one PIP move down-ward will lead to the price being 1.1740. NB: Unlike US$ quotes which have four decimal places, YEN based p...