The Gartley - Harmonic Pattern
Harmonic
Pattern – The Gartley
Harmonic Patterns enable traders to
determine turning points with precision and high accuracy. In our introduction
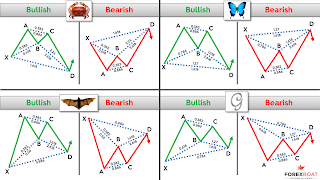
to Harmonic Patterns, we indicated that; all Harmonic patterns have five points
– namely, “XABCD”.
Of the five points, the market
always provides “XA” which is the impulse leg/move. Therefore the trader is
required to identify the remaining points - “BCD”.
The Gartley pattern is the most commonly
used harmonic pattern, and it was founded by an American ‘Harold McKinley
Hartley’ (H.M. Hartley) in 1932.
Like all Harmonic patterns, The Gartley
is based on the Fibonacci retracement numbers, and it is used to help traders forecast/identify
turning points on the market-trend chart. It is therefore a good indicator on
when to enter or exit trades.
Using the Fibonacci tool, the
Gartley pattern identifies BCD points by using the following measurement Criteria:
-
>Point ‘B’ is 61.8 retracement of
leg “XA”.
>Point ‘C’ is between 38.2 to
88.6 retracement of leg “AB”.
>Point ‘D’ is 78.6 retracement of
leg “XA”.
All harmonic Patterns complete at point "D", this
is the ‘Potential Reversal Zone’ (PRZ).
For the Gartley Harmonic pattern, First
Take Profit (TP) is at 38.2 and second TP is at 61.8. Stop Loss (ST) is
set a few pips below (bullish) or above (bearish) "D". This is the case
with all Harmonic patterns.
Before a decision to enter or exit a
trade is taken, it is highly recommended that such a decision is supported by three
or more other patterns/indicators (a Confluence of indicators thereof), these may include the usual candlestick reversal
pattern, head and shoulders, double bottom, double top, flags, wages, triangles
– etc. Price action analysis is another powerful approaching to
analyzing the market.
As the most used Harmonic Pattern, The
Gartley is a formidable tool that if used correctly can positively turn traders’
fortunes - in a big way.
OJ Mwale – Sani Global


Comments
Post a Comment